⋆˙⟡ Welcome to Rosemary’s Blog !⟡˙⋆
A little about my page:
I started this REU on 05.21.2024 Throughout my time here my goal is to update every 1-2 days and share my progess, setbacks, and thoughts that i’ve had along the way.
May 21st - May 24th
My first day was on Tuesday May 21st and my first tasks were:
- Set up Anaconda Python
- Set up Visual Studio Code
- Have our GitHub ready for use
- Document my steps for my teammate arriving later on
- Read Connor’s Thesis to get a better idea and understand what the goals of the research project are
- Familiarize myself with Pandas to make data analysis easier later down the road
After I had my environment setup, I spent time understanding the raw data connor had collected for his thesis and looking through his code to further understand his work.
May 28st - May 31th
The second week we decided I was prepared to focus on our sensors!!
Purple Air:
Our team started by making two API keys (read & write) with Purple air. We then set up our first two sensors in our workplace on the second floor of Sprauge to test out data collection, using the new API, and overall just practice working with them.
Later on this week we met Professor Hawkins and she had introduced us to the rest of the sensors Connor used for his thesis. We created a group to track all of them at once At this point we had 8 Purple Air sensors
- HMC Jacobs 1
- HMC Jacobs 2
- HMC Jacobs 3
- HMC Jacobs 4
- HMC Jacobs 5
- HMC Jacobs 6
- Sprauge: floor 2
- SpragueFloor2
Check out the sensors on the map!–> https://map.purpleair.com/1/mAQI/a10/p604800/cC0#16.9/34.105133/-117.712128
To make sure they were working we decided to test their collection by making a simple plot showing how humidity and temperature values on different sensors relate to each other. (important in Connors thesis)
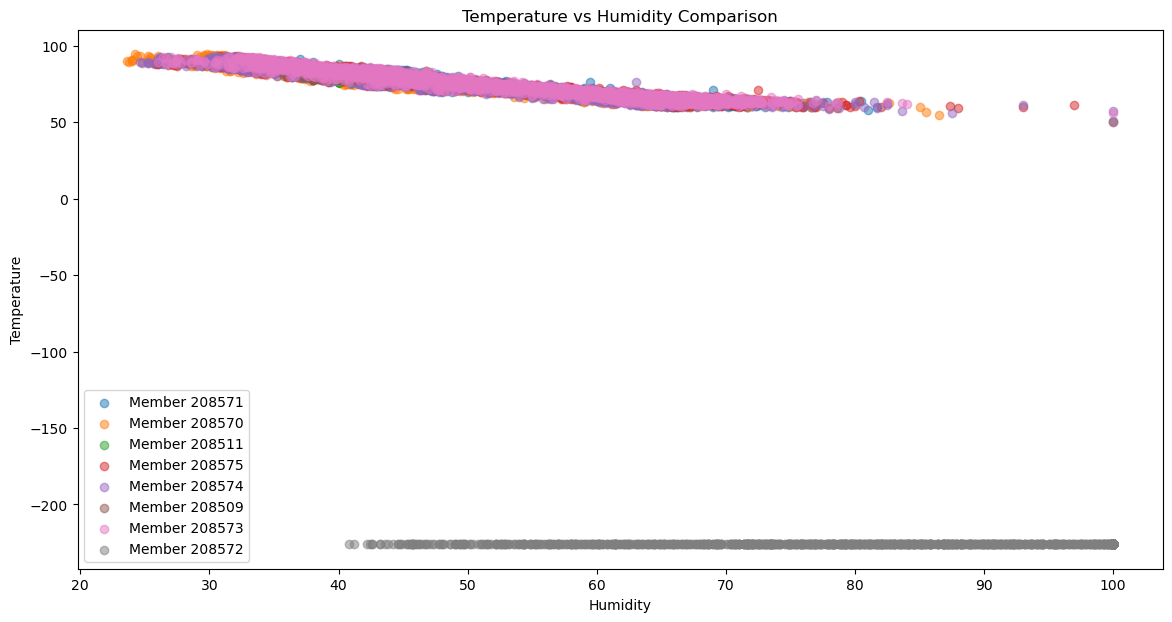
From this plot we decided that one of our sensors (grey HMC Jacobs 1) was not working properly ᴖ̈ so we will not be using it for our data collection period.
QuantAQ:
Dominick focused on this sensor more!
June 1st - june 10th
During week 3 and 4, we were posed with a bunch of tricky problems and situations that we had to work around. We took our first field trip to the roof of Jacob’s and got to see the senors, how they are connected, and what is missing to have them working fully. Professor Hawkins was able to get the mass spectrometer up and running for us.
While all of this was going on, we had decided to also start uploading any important code that we had made to a github repository to make sure we would both have access when it came to actually working with our data later on. Other housekeeping tasks included filling our necessary paper work for our mentee that its coming in on June 24th!
Purple Air API limit Reached
We ended up reaching the maximum ‘free’ API calls so we had to contact support to remove that blockage for us since we own the sensors. This took a few days.
While we figured this out, we also took the chance to ask the support team how we could fix the Purple Air sensor since it was not giving correct readings for tempreature and humidity. They sent us a tutorial video to fix the readings. Me and Dom took it apart but it seems like it is still broken so we will be reaching out again to see if there is someting else we could try.

Rasberry pi!
The initial problem with our Rasberry Pi is that the connection was not working so we were not able to use the to pi –> WXT data acquisition(managing data from WXT series wether stations NOAA) –> CPD3 is a compact power and data device that will power the WXT and handle the data transmission.
Important Key points that helped me understand:
- installing: conecting the WXT station NOAA to the CDP3 device ‘vaisala’ software on windows in Hawkins Lab
- configure the CPD3 which me and Dom did in the rasberry pi
- then the weather station collects the data –> sends back to CDP3
We are still working on being able to collect the data from the met sensor.
June 11th - June 14th
This week we prioritized being able to collect data from the met sensor and finalizing our other sensors to start officially collecting data We made a lot of progress with the help of Connor’s emails and Sydney’s lab notebook.
Met sensor data collection
So basically we were taking the wrong approach towards collecting the data thinking that we had to use the NOAA weather station and much more when everything was just on the rasberry pi the whole time. We decided that we could just ssh into the pi to look at what its doing and run the script directly on there , and since it is already connected to the sensor, it saves directly to the micro sd card. This was really frusterating to figure out because it was wayyy easier that what we thought it was but its okayyy.
Things we had to do/fix:
- pyserial
- create an env + source myenv/bin/activate
- make a script to run (can’t forget to update and run)
- make sure it is logging correctly
One thing however that was not adding up was ~ how do we run the script continuosluy without interupting?~
WELL Sydney had an answer to that which was using SCREEN! Screen allows us to detach and keep our script running in the background without interupting We installed screen and so far it has been working great. We were able to run for about a whole day while saving files in 10 minute intervals as our testing. Me and dom think that its working perfectly fine so now my next questions is
~ how to I get all these files to me without having to log in every time and without overflowing the pi with a bunch of data?~ (the pi also looses connection very often so this is important!)
my answer to that is using rclone? I am still figuing this out and kinda failing since the connection loss from the pi is frequent but according to the documentation and stackoverflow it should work at the end and automatically add the new data files to our shared google drive for easier access.
Broken Purple Air Sensor Update
After going back and forth getting help to fix our sensor (Thanks to Dom), we found that it’s dead and we need a replacement. The Purple air guy was nice enough to send us a new FREE SENSOR!!
This was great since we were getting tired of taking the sensor apart, getting it work, putting it back together, and it dying on us again repeatedly.

In the meantime, we decided to put up one of our extra sensors on the roof as a replacement.

June 15th - June 20th
We have been using screen every since and was able to collect full day data from June 15th - June 17th. after that something happened with screen and it had stopped running which sucks because we have lost 2 full days of data due to this.
I do not think that it was user error since I had two screen sessions going on (one running our script and one not) and when i went back to download our files using scp, both sessions were discarded. Im not sure what the couse of that could have been but I plan to look it up and maybe read about some people that couldv’e had the same thing happen?
Besides that, we are preparing and making simple instructions for Valeria to test out and see if they are clear enough for a beginner to follow.
Pitch || Presentation
Me and Dom also gave a short ~12 min presenatuon about what our project is and how far we have gotten so far. SPACES presentation We also got special roof goggles! For our trips to the roof which is very exciteing.
data downloading
Apart from the lost met sensor data, we have also been downloading data from the ACSM using a usb drive. We found negative numbers when measuing NH4. I think this will be averaged out at the end but I will make sure to let professor Hawkins know about it just in case.
Data Analysis Scripts
I will now start to dedicate half of my day to building simmilar python scripts as connor and the other half towards working on the mobile air sensors.