Welcome to Dominick’s Blog Page
On this page I will post 1-2 times a week on my progress throughout the project!
Week 1(5/28 - 5/31)
Overview
During my first week of research it was important that I setup a great foundation to make data collection work as smoothy and accurately as possible. This included setting up the correct tools, familarizing myself with Connor’s thesis, and reading documenation for API’s. It was also important to identify the main goals of the project. Although, we are collecting air quality data from low cost sensors to compare with previous recorded data to analyze the effectiveness of these sensors. It is important to understand that as we are doing this collection we want to make the process as easy as possible to understand and follow for those who do not have a technical background.
Setting up My Environment
On my first day I was tasked with settimg up my environment which involved the following:
- Setting up Anaconda Envrionment
- Setting up Visual Studio Code
- Getting Juypter Notebooks to Work With Visual Studio Code
This was an essential first step as it created an environment where I have the necessary libraries needed to effectively collect data. Also, setting up the environment allowed for me to analyze Conner’s Code and get a better understanding of the goals of the project and what comparisons, graphs and charts we will be creating when we collect our data.
Understanding the Thesis
After creating my environment I decided that it was in my best interest to throughly go through Conner’s thesis and get a great understanding of the main concepts and his findings/results. It was especialy helpful looking through his methodolgy which cleared up a lot of gaps of knowledge that I had when going through his code. Throughout the weeks I will continue going through his thesis and code periodically so that I have as best of an undertsading of the science and math behind the graphs and charts so when we are done with our data collection showcasing that data will go as smoothly as possible.
Learning How to Work With API’s
Before working with the API’s we setup PurpleAIR sensors just to see how they functioned which can be seen on the real time map here. Once we familarized ourselves with our sensors we wanted to create a group where we could add all the PurpleAir sensors on the roof and our sensors so that we could collect data in a group rather than individually. This involved reading PurpleAIR API documentation.
Code Snippet(PurpleAir):
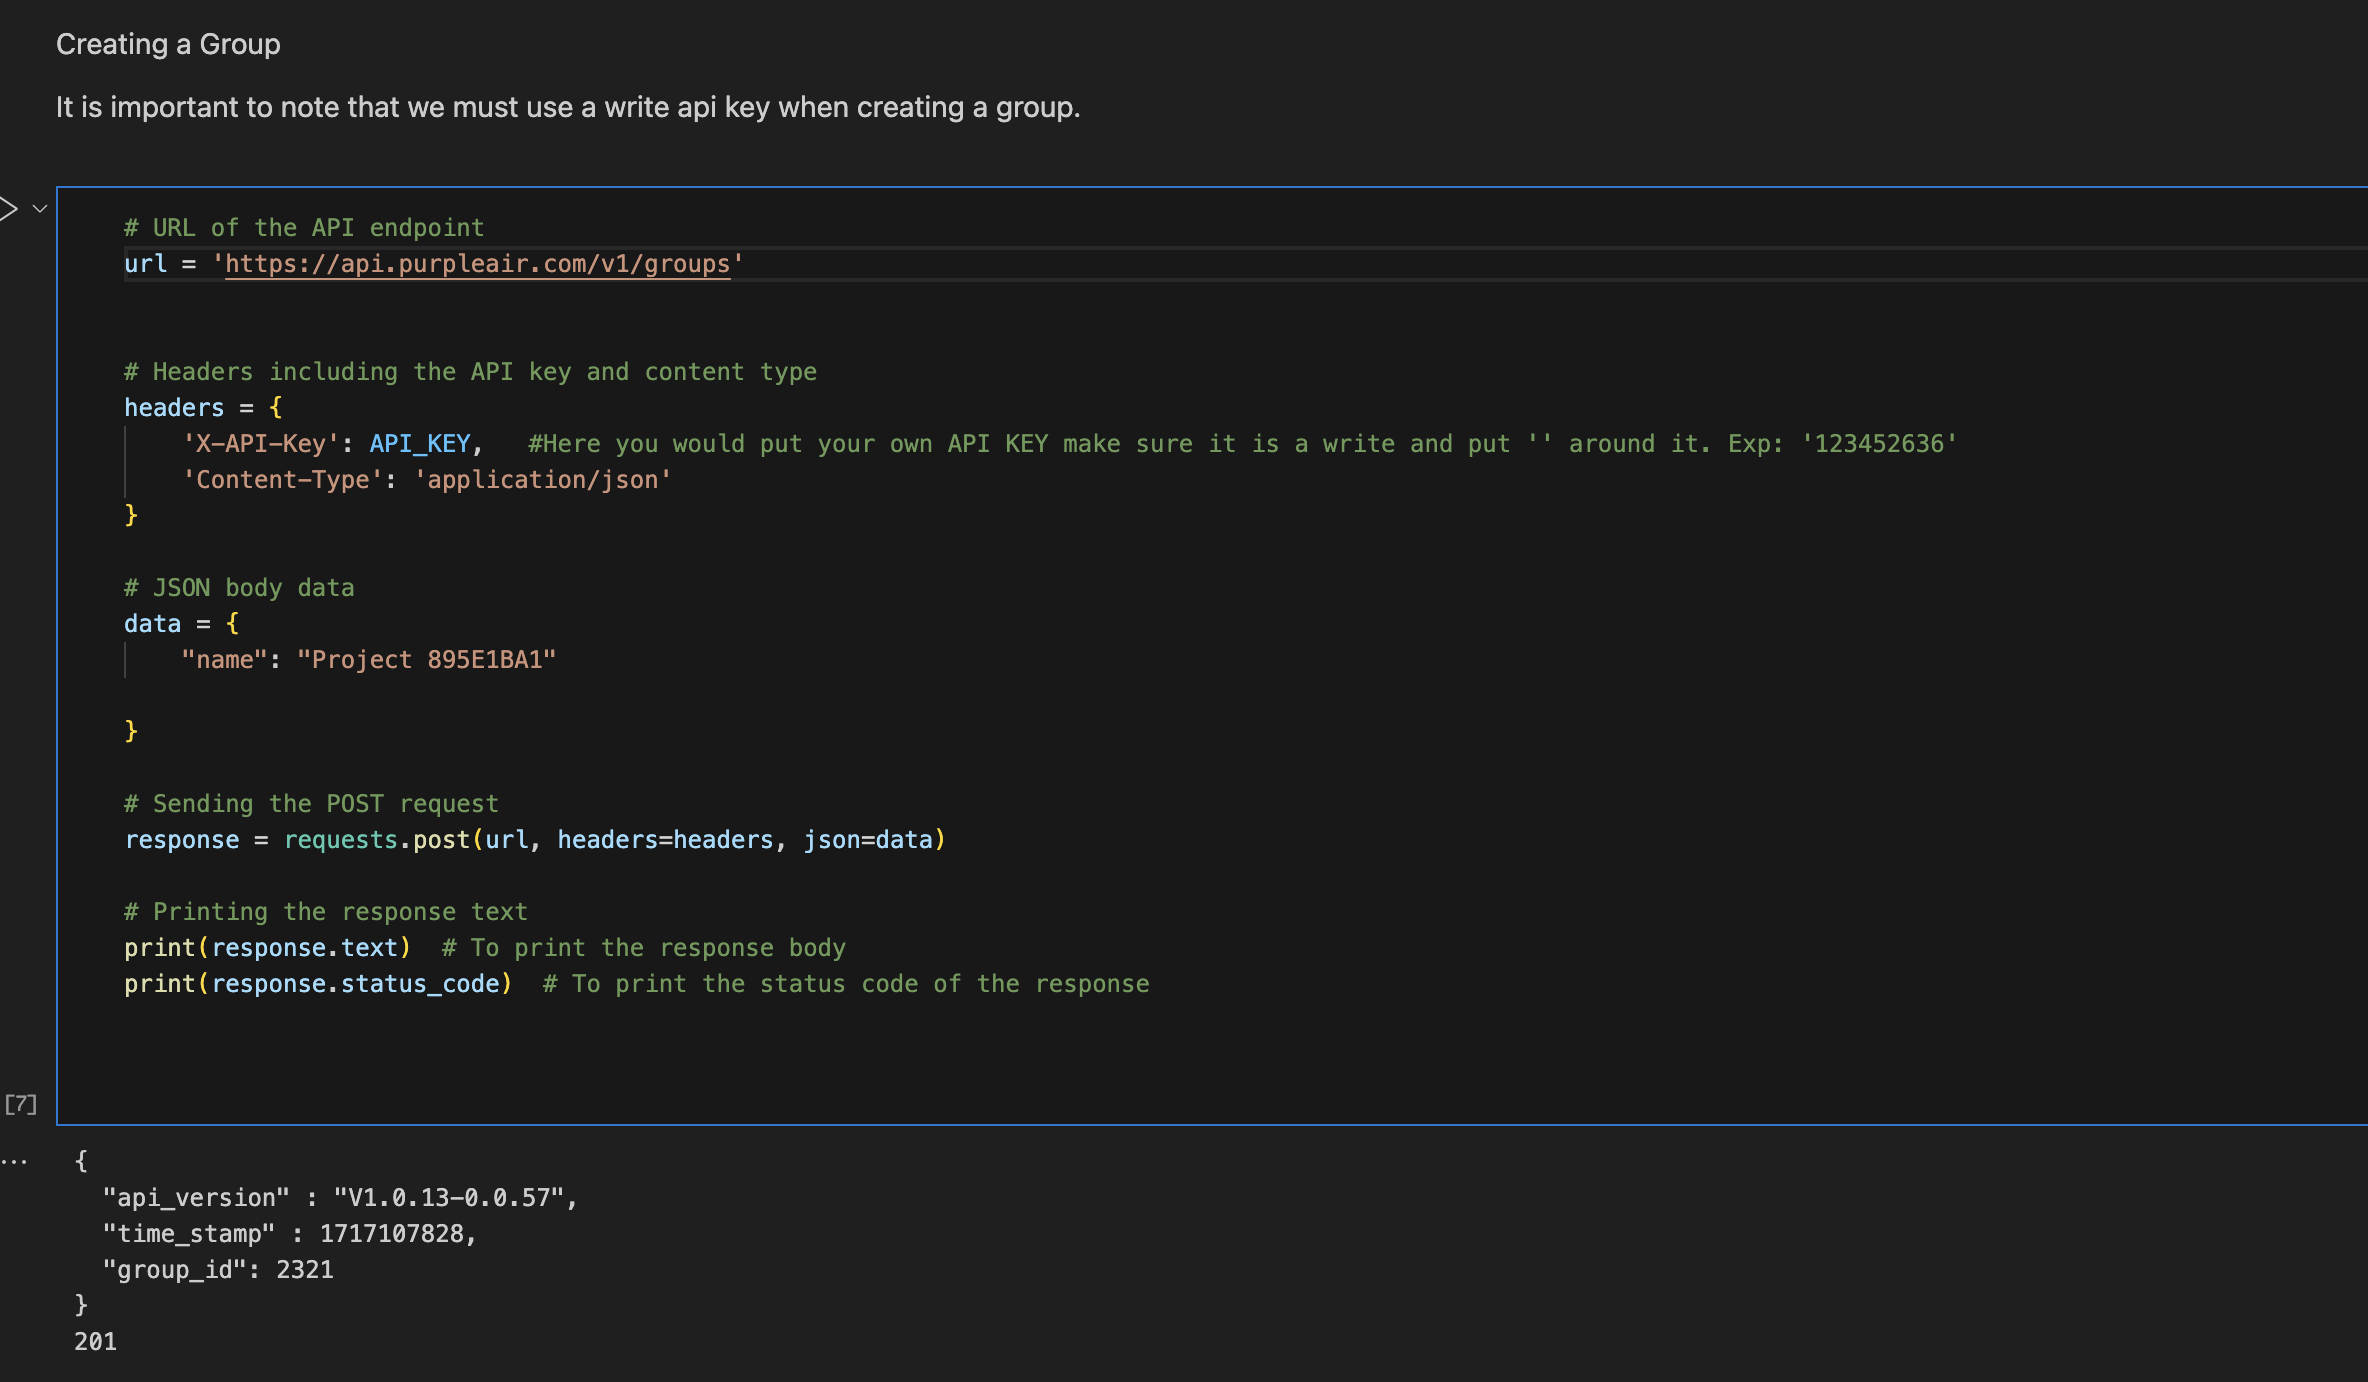
This is a quick snippet of creating a group for the PurpleAIR sensors. In the rest of the code we add the differnt members(sensors) into the group.
Next, there was the process of working with the QuantAQ API. Unfortunately, there is no grouping function to access the sensor data so they must each be called individually. Using an api key and a basic get resposne fucntion we were able to acess the from the QuantAQ sensors including but not limited too PM1, PM2.5, and PM10 data which we also recieved from the PurpleAIR sensors.
Code Snippet(QuantAQ):
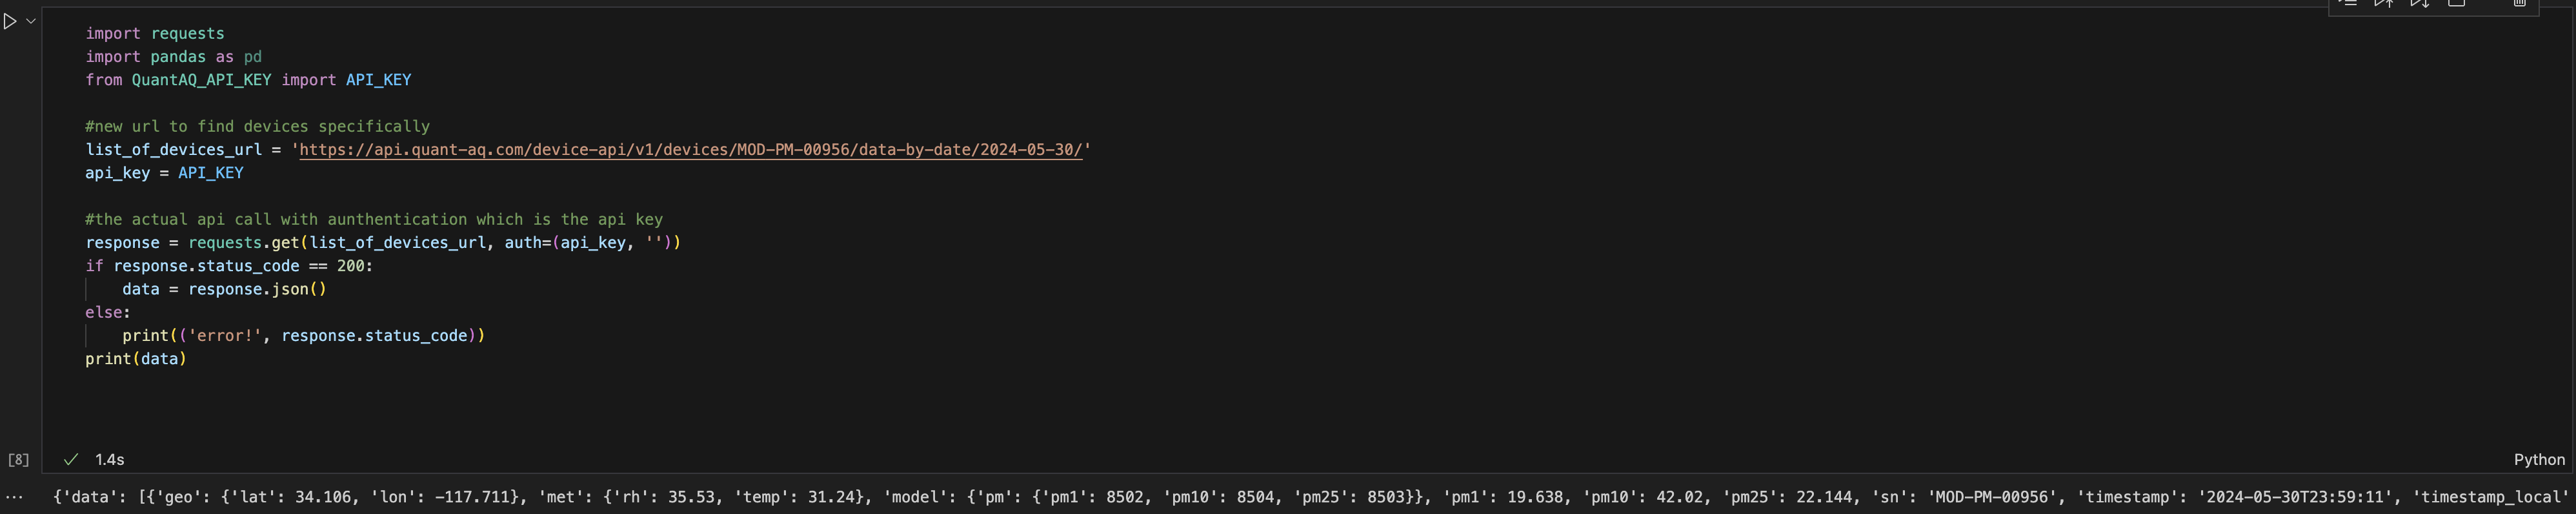
Here in This image we see a basic API request from one of our QuantAQ sensors. This was then formatted with pandas and stored into a csv file wich could later be accessed for future comparisons and graphs!
Week 2(6/2 - 6/7)
Week 2 was entailed with a lot of housekeeping and preparation for future task. We both were tasked with the creation of the github repository for storing our code. We first ran our coe to make sure it worked before pushing it into the repository. After running our code we went through the process of learing how to properly commit code to a github repository from vscode. I personally ran into a couple of problems but after several failed pushes to the repository I finally figured it out and learned a lot along the way. The PurpleAir group code and QuantAQ api call is now available on the repository labeled data anylsis. We also ran into an issue with our api keys but it was resolved by contacting PurpleAir support.
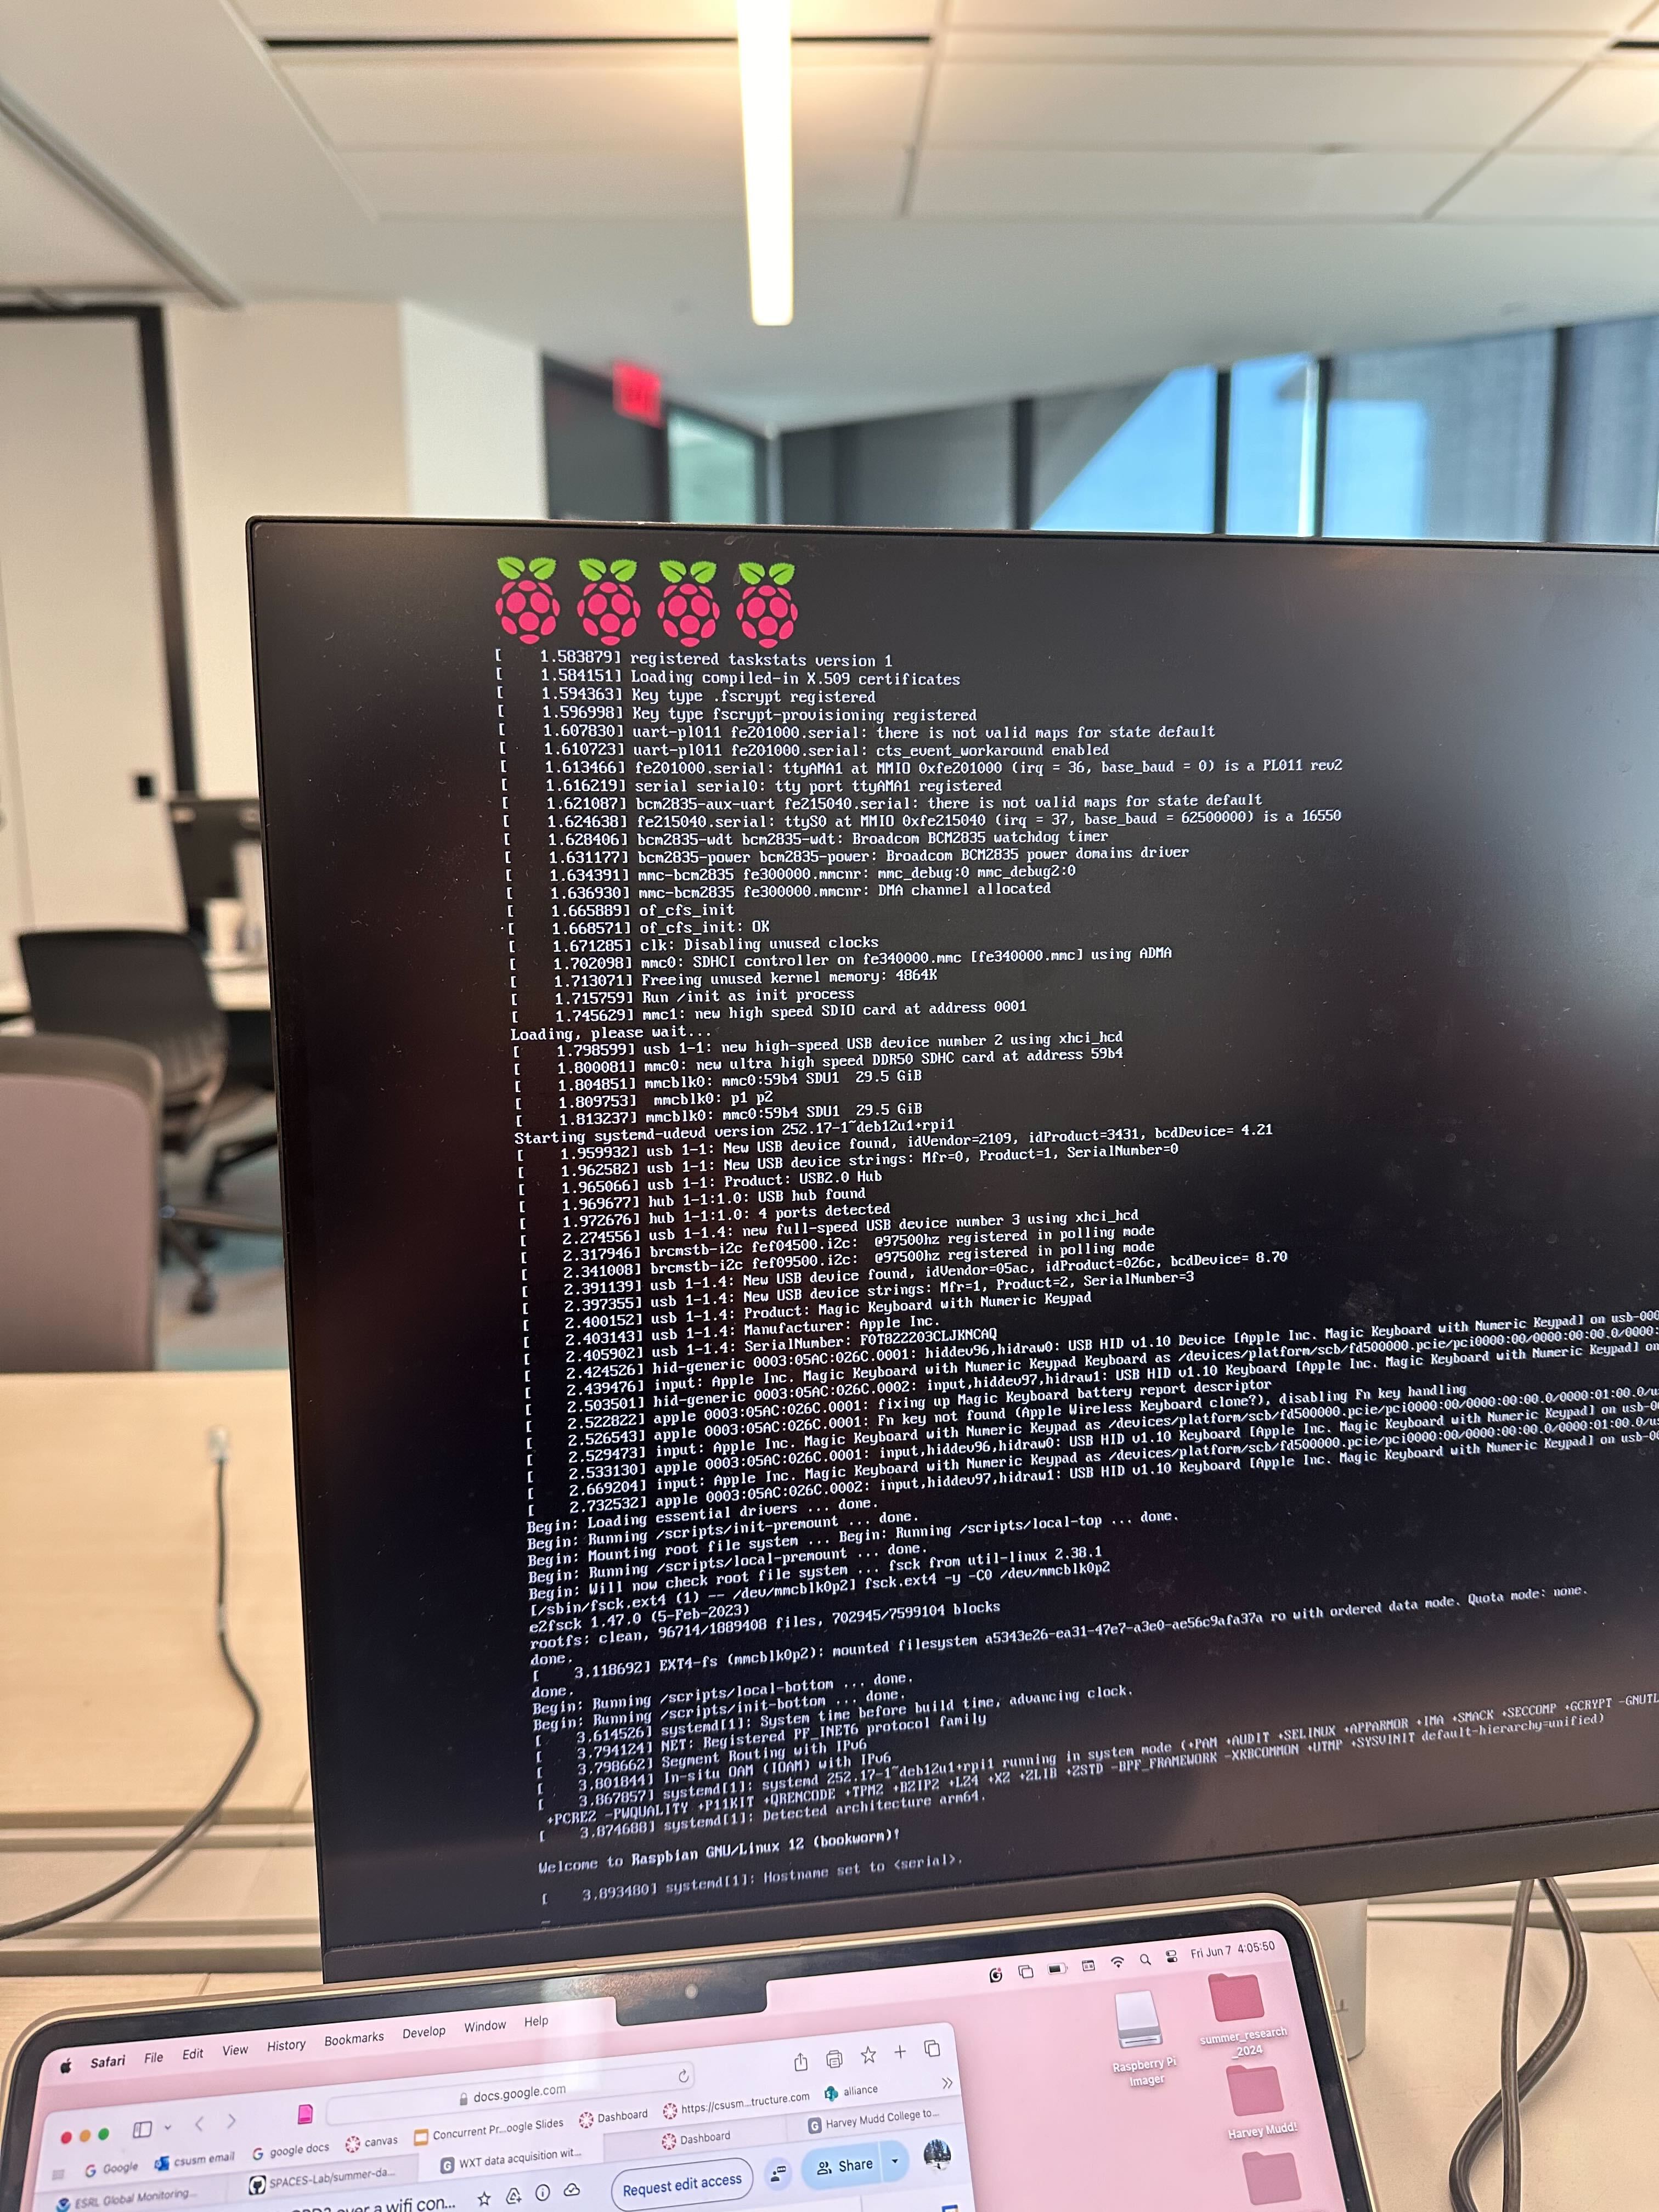
During this week we went up to the roof to observe the MET sensor which is responsible for measuring pressure, temperature, humidity, rain, and wind. The sensor is currently not working and throughout the week we read documentation to see how it works. We then began troubleshooting the raspberry pi that is getting data from the MET sensor and pushing it to NOAA’s CPD3 server where we can see the readings. We are currently in the process of getting the rasperry pi to recive data from the MET sensor. Throughout ths process we have learned a lot about raspberry pi’s and how vi and nano terminals work.
Week 3(6/10 - 6/15)
This week we focused on fixing the MET sensor (Meteorology Sensor) to collect data so we will be able to start our total data collection. The MET sensor measures temperature, humidity, pressure, etc and gives us necessary data to fill in any gaps that may occur in the data from the LCS’s.
We began our process by first looking at documentation from the NOAA webiste to get the data from there however it wasn’t working corrrectly so we decided to switch processes. We were given Sydney’s Folder which contains the work and documentation she did when configuring the rasperry pi. She forunately had a python script that showed us how to convert the serial data that was coming from the MET sensor to convert it into a regular data and put it into a csv file and store it in the rasperrypi. This finally gave a process that we could follow to get the MET sensor up and running!
Our Process
- We created an environment in the rasperry pi terminal which is where would create the pyscript
- Download the necessary libraries to run Sydney’s code
- Edit and Add to Sydyney’s Code
- Download Screen so that we can remotely access the raspberry pi and look at the data that it is collecting without disrupting the collection process.
- Backup files to google drive.
After two long and frustrating weeks we finally got the MET sensor to work and started our data collection officially on June 15th!!!
Week 4(6/17 - 6/21)
Now that we have began our data collection we will now shift our foucs to the hardware part of our research. In the hardware sector of our research we are looking to add gps a gps and microSD module to the prexisting CanAirIO model. A CanAirIO is a device device that is portable and its purpose is to track air quality in specific areas. We want to improve the technology as the gps location and data can only be viewed through the app. However, if we are able to add a gps and microSD card to the existing circuit we would be able to download that data directly from the device itself instead of using the app. This would be benificial because you wouldn’t need a wifi connection or mbile device to use this device which would be helpful if you are a child or in araeas with poor wifi connection.
CanAirIO Bike
This is the current model that we are looking to improve.
Schematic
As shown the first schemtic is testing and functioning. However we want to see if we can add the gps and microsd components.
Week 5 and 6(6/24 - 7/3)
This week is where we began to actually solder and build the sensors from scratch. It was a long process with lots of mishaps but we were succesful in making two working sensors. I personally learned that two wires can go to the same output by just stripping them and weaving them together then soldering. We were able to get readings form the sensors which was great!